 ..the cat came back..
Recently Written
- Kiosk Browser Grows Up, Goes Pro
- Android App: Simple Kiosk Browser
- Widget, it’s got a widget…
- LinkUSB(i) and 1-Wire setup
- I am an IAMS cat
- LG TV Serial Control
- Tivo Return to UK Via Virgin Media
- Another Android Security Update
- Pictures from Computex 2009
- Pull That Squidgy iPhone application
- Extra Cupcake, Still No Latitude
- G1 Assault on battery
- Everywhere you go, always take the weather with you
- Pachube dials without the heartache
- Dynamic Dials Disclosed
- Gratifying Graphic Gizmos
- Current Cost Capers
- One Wireduino made easy
- WordPress tweetbacking
- What the UK VAT Reduction really means
Categories
- 1-Wire

- android
- arduino
- computex
- freerunner
- hardware
- image builds
- iphone
- kiosk
- learning
- linux
- neo 1973
- openmoko
- opensource
- personal
- software
- VoIP
Archives
- November 2011
- July 2011
- May 2011
- January 2011
- October 2010
- November 2009
- July 2009
- June 2009
- May 2009
- April 2009
- March 2009
- February 2009
- January 2009
- December 2008
- November 2008
- October 2008
- September 2008
- August 2008
- July 2008
- June 2008
- April 2008
- March 2008
- February 2008
- January 2008
- December 2007
- November 2007
- October 2007
- September 2007
Admin
Search
Mar
21
Everywhere you go, always take the weather with you
15 years ago, mid-March | Leave a Comment
Originally I wasn’t going to blog about this but I finally gave in so here it is. This is another one of those things that you really just can’t do with your iPhone unless you’ve jailbroken it.
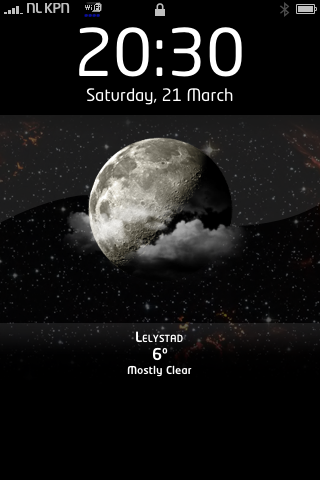
Having the weather on your lock screen is nothing particularly new, there are enough Winterboard themes that allow you to do this. However, this is slightly different. I’ve never really understood why you’d only ever want to know what the weather was like in your home town. What does it matter? That is of course unless you never actually go anywhere. Why not have the weather for where you are? Yes I know you could just look out of the window or actually go outside but that’s beside the point. What I wanted was to have the weather for where I actually am right now. So, as part of my iPhone tracking system I added the ability for the weather to follow me too. The implementation is rather simple.
Since I’m already sending my location and retrieving the wallpaper image I’m also getting an override (overRide.js) for my weather configureMe.js. The overRide.js contains a single line, the location – as per the configureMe.js format:
var locale="Lelystad,NL" |
So each time the wallpaper is updated, so is this file. One of the key things you need to do to accomplish this for yourself is what is called reverse geocoding. That is, getting the name of your location from your GPS coordinates.
Now, the best way I’ve found of doing this so far is by using geonames this is a fantastic site that allows you to do the reverse geocoding without even blinking. For example, calling geonames using the url
http://ws.geonames.org/findNearbyPlaceName?lat=50.455&lng=-3 |
would result in the following xml being returned
<?xml version="1.0" encoding="UTF-8" standalone="no"?> <geonames> <geoname> <name>Seaton</name> <lat>50.7049382166946</lat> <lng>-3.06999206542969</lng> <geonameId>2638278</geonameId> <countryCode>GB</countryCode> <countryName>United Kingdom</countryName> <fcl>P</fcl> <fcode>PPL</fcode> <distance>28.2265</distance> </geoname> </geonames> </xml> |
This gives you pretty much everything you could possibly want and for free too. Note the inclusion of your distance between your coordinates and the the coordinates returned (nearest named location).
Now I know what you’re thinking. Why would I retrieve a file with the data in it from my server, why not parse the xml in the javascript on the lock screen. You’re right, I could and you, possibly, should. I don’t because I keep all my GPS data in a database on that server so I update the database with the actual locations too. I don’t parse the xml on the iPhone because I don’t need to.
Of course I haven’t yet tested being in some obscure location that the weather provider doesn’t know about. Incidentally, geonames is so freaking good that, if you want to, you can download a daily dump of the database.


Tagged with: GPS • iphone • jailbreak • opensource • software • tracking
March 21, 2009 18:11
Mar
5
Pachube dials without the heartache
15 years ago, at the start of March | 1 Comment
Some people might not want to have their own web server and php installs just to use their Pachube feed to show a dial or two so let me introduce to you the simple way of getting this all to work. Go over to my Pachube app page and follow the on screen instructions. You’ll end up with some text to copy and paste into your web page. All done for you all lovely and simple.
Update Added the ability to de-wiggle the value needle, and then fixed a bug in the wiggle.
Tagged with: opensource • Pachube • software
March 5, 2009 16:51
Mar
4
Dynamic Dials Disclosed
15 years ago, at the start of March | Leave a Comment
There’s been quite a bit of interest in my electricity usage dial like the one below so I’m going to go through how I did it with you. The first thing you’ll need is the XML/SWF Gauge and a web server with PHP. It’s possible to do this on a web server running Perl or  ASP but you’ll need to do that yourself. For this example I’m also using a Pachube account to grab the data. My feed, the one for my gauge on the top right, is 1498 but you will want to create your own account and start updating your own data. Using the gauge is as simple as a simple thing.
There are a number of things we need to get this simple display working,
- 1. The .SWF file
- 2. An gauge.html page to show the gauge
- 3. A data fetch PHP script
1. The .SWF file
We’ll come to that at the very end of the article.
2. The gauge.html file.
Open your favourite text editor and cut and paste the following into it.
1 2 3 4 5 6 7 8 9 10 11 12 13 14 15 16 17 18 19 20 21 22 23 24 25 | <HTML> <BODY bgcolor="#FFFFFF"> <OBJECT classid="clsid:D27CDB6E-AE6D-11cf-96B8-444553540000" codebase="http://download.macromedia.com/pub/shockwave/cabs/flash/swflash.cab#version=6,0,0,0" WIDTH="200" HEIGHT="100" id="gauge"> <PARAM NAME="movie" VALUE="/data/gauge.swf?xml_source=/getdata.php" /> <PARAM NAME="quality" VALUE="high" /> <param name="wmode" value="transparent"> <param name="allowScriptAccess" value="sameDomain" /> <EMBED src="/data/gauge.swf?xml_source=/getdata.php" quality="high" wmode="transparent" WIDTH="200" HEIGHT="100" NAME="gauge" allowScriptAccess="sameDomain" swLiveConnect="true" TYPE="application/x-shockwave-flash" PLUGINSPAGE="http://www.macromedia.com/go/getflashplayer"> </EMBED> </OBJECT> </BODY> </HTML> |
Save the file as gauge.html.
3. A data fetch PHP script.
Start a new document and cut and paste the following. Before you save the file as getdata.php make sure you change the $myFeedId and $myFeedStream values to match your Pachube feed.
1 2 3 4 5 6 7 8 9 10 11 12 13 14 15 16 17 18 19 20 21 22 23 24 25 26 27 28 29 30 31 32 33 34 35 36 37 38 39 40 41 42 43 44 45 46 47 48 49 50 51 52 53 54 55 56 57 58 59 60 61 62 63 64 65 66 67 68 69 70 71 72 73 74 75 76 77 78 | <? $myFeedId=1498; $myFeedStream=1; $myURLPath='/getdata.php'; $url = "http://www.pachube.com/feeds/$myFeedId/datastreams/$myFeedStream/history.csv"; $now = gmdate('Y-m-d').'T'.gmdate('H:i:s').'Z'; $ch = curl_init(); curl_setopt($ch, CURLOPT_URL,$url); curl_setopt($ch, CURLOPT_SSL_VERIFYHOST , false ); curl_setopt($ch, CURLOPT_SSL_VERIFYPEER , false ); curl_setopt($ch, CURLOPT_HEADER, 0); ob_start(); $result = curl_exec($ch); $resultStr = ob_get_contents(); ob_end_clean(); curl_close($ch); if ($result) { $readings = split(",",$resultStr); $last=(($readings[count($readings)-1])/40); $prev=-90+(($readings[count($readings)-2])/40); $mval = (max($readings)/40); $tval=-90; header("Content-Type: text/xml\n\n"); ?> <gauge> <update url='<?=$myURLPath;?>?m=<?=$mval?>' delay='909' delay_type='1' timeout='30' retry='9' /> <? RadialTicks( 100, 75, 60, 15, -90, -45, 12, 3, "33ff33" ); RadialTicks( 100, 75, 60, 15, -45, 0, 12, 3, "efe415" ); RadialTicks( 100, 75, 60, 15, 0, 45, 12, 3, "ef8b15" ); RadialTicks( 100, 75, 60, 15, 45, 94, 12, 3, "ff3333" ); ?> <text x='40' y='50' width='220' align='left' size='10' color='000000' alpha='20'><?=$now;?></text> <text x='150' y='100' width='120' align='center' size='24' color='000000' alpha='100'>Watts (W)</text> <rotate x='100' y='75' start='-90' span='<?=$mval?>' step='3' shake_frequency='0' shake_span='3' shadow_alpha='15'> <polygon fill_color='ff0000' fill_alpha='90' line_alpha='0'> <point x='97' y='5' /> <point x='101' y='5' /> <point x='102' y='63' /> <point x='96' y='63' /> </polygon> <rect x='94' y='87' width='10' height='10' fill_color='ff0000' fill_alpha='90' line_alpha='50' /> </rotate> <rotate x='100' y='75' start='<?=$prev?>' span='<?=$last?>' step='1' shake_frequency='95' shake_span='3' shadow_alpha='15'> <polygon fill_color='000000' fill_alpha='90' line_alpha='0'> <point x='100' y='10' /> <point x='101' y='10' /> <point x='101' y='63' /> <point x='96' y='63' /> </polygon> <rect x='94' y='87' width='10' height='20' fill_color='000000' fill_alpha='90' line_alpha='50' /> </rotate> <circle x='100' y='75' radius='14' fill_color='000000' fill_alpha='50' line_alpha='0' /> </gauge><? } function RadialTicks ( $x_center, $y_center, $radius, $length, $start_angle, $end_angle, $ticks_count, $thickness, $color ) { for ( $i = $start_angle; $i <= $end_angle; $i += ($end_angle-$start_angle)/($ticks_count-1) ) { echo " <line x1='".($x_center+sin(deg2rad($i))*$radius). "' y1='".($y_center-cos(deg2rad($i))*$radius)."' x2='" .($x_center+sin(deg2rad($i))*($radius+$length))."' y2='" .($y_center-cos(deg2rad($i))*($radius+$length)) ."' thickness='".$thickness."' color='".$color."' />\n"; } } ?> |
Copy the .swf file that you downloaded from the XML/SWF Gauge site and put it on your web server along with your gauge.html and getdata.php files. Point your browser at your website and the gauge.html page and bask in your glorious meter display.
I should point out that this is using the historic feed data from pachube which has a 15 minute lag. The reason for this is simply because it does not require authentication with the pachube servers. If you want to use your live feed you will need to change the url used and the management of the data returned as well as adding
1 | curl_setopt($curl, CURLOPT_USERPWD, "username:password"); |
just before the ob_start(); on line 16. Replace username:password with your actual username and password, don’t forget the colon in between. When changing the url you might want to use the secure https rather than just http.
Tagged with: opensource • Pachube • software
March 4, 2009 18:08
Mar
1
Gratifying Graphic Gizmos
15 years ago, at the start of March | 2 Comments
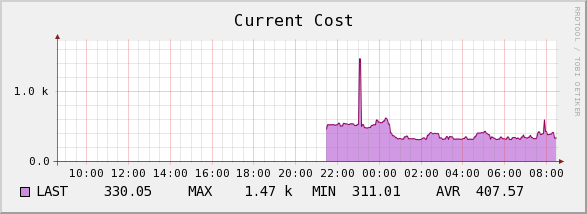
Yesterday the Current Cost unit actually got installed for real, something I was dreading. Dreading not because it was a difficult thing to do but simply because I expected the figure it would show would be terrible. Guess what, it wasn’t. In fact it seemed to be fairly close to that of other people who are monitoring theirs. The initial figure of 371 Watts didn’t last too long once the dishwasher and oven came on and an interesting spike appeared when the hob went on for the kettle.

Continuing with my sudden graphing fetish, as well as using a Current Cost unit I have dotted a number of little devices I’ve built with Xbee and Arduinos to measure temperatures (and other things) around the house. More information on those will come out later, but it’s an interesting project too.
Since I have the data for those it’d be rude not to graph them too, there’s a sample in the thumbnails below.
Not content with graphing them locally I picked up a Pachube invite and started graphing data there too. The process is simple really and as you can see on the right hand side of this page under ‘Graphy Stuff’, graph images can be embedded in your own or other sites. The really interesting thing about Pachube is that you can share your data with people who may be interested. The data they get to see is delayed by approximately 15 minutes. If you output your data in the eeml format then you can specify your own tags too.

Tagged with: 1-Wire • arduino • development • environment • hardware • monitoring • Pachube • software
March 1, 2009 8:47
Current Electricity Use (15min)
iPhone/Webkit RSS Reader
Links
- automated home
- Automated It Technology News
- awooga!!!
- LinITX
- My Acer page
- My Asterisk pages
- My Work in progress (old)
- Noble Race Car
- openmoko / neo 1973 wiki
- planet openmoko
- Spadgecock Cumpants
Tags
1-Wire android api Apple arduino currentcost DDAR development DVD FIC freerunner G1 google Google Phone gphone gprs GPS hardware image image builds inspiration iphone jailbreak kiosk linux Mac monitoring Music neo 1973 Nokia openmoko opensource OSX Pachube personal qtopia rhubarb rikki Rio slimp3 slimserver software tracking Trolltech u-bootTwitpic
Graphy Stuff


